Dashboard
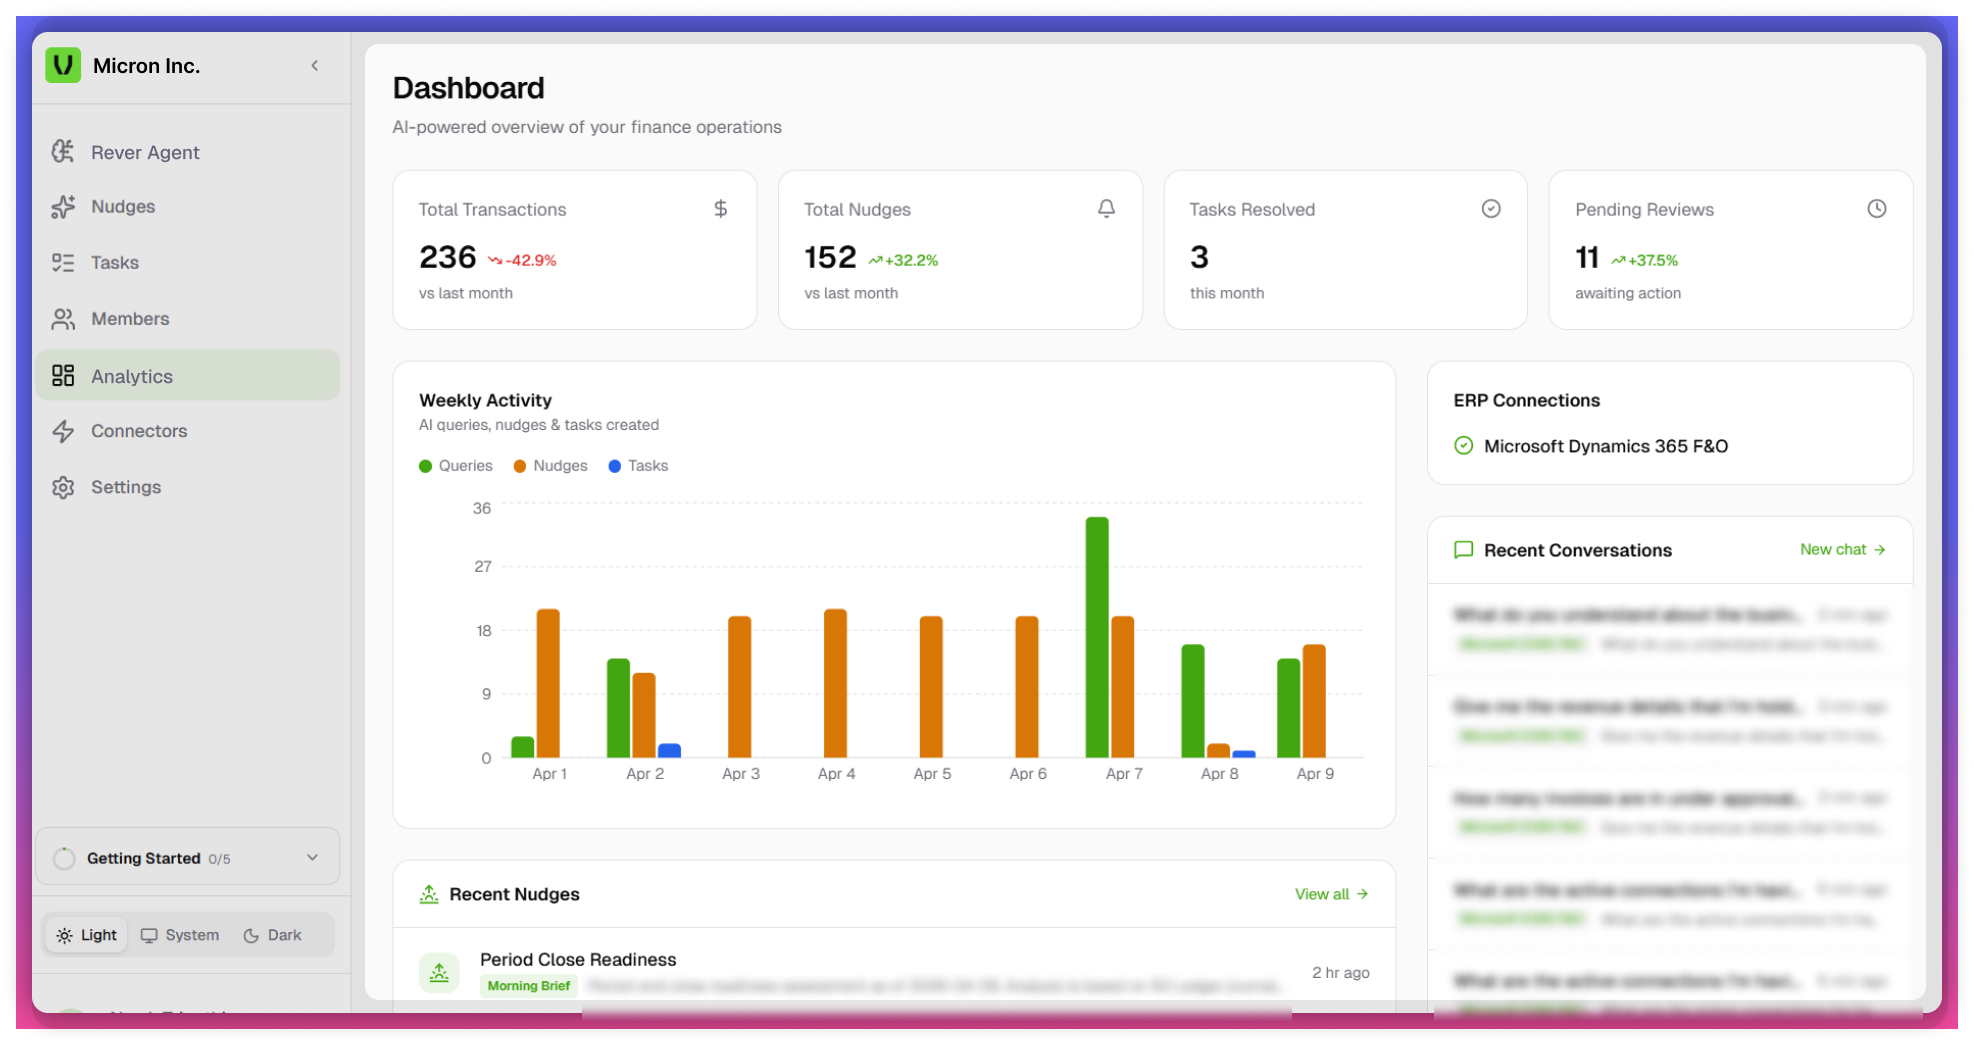
The Dashboard provides a centralized, AI-powered view of finance operations, enabling users to monitor transactions, nudges, tasks, and system activity in real time. It helps users quickly assess performance, identify issues, and take action.
Accessing Dashboard
- Navigate to the Dashboard from the left navigation panel.
- The dashboard loads automatically with real-time data.
note
All data displayed is dynamic and updates based on system activity and connected ERP integrations.
Flow
- Review high-level KPIs
- Analyze weekly activity trends
- Check ERP connection status
- Review recent conversations
- Navigate to relevant modules for action (Tasks, Intelligence)
Dashboard Sections
Key Metrics
Provides a quick snapshot of system performance.
- Total Transactions
- Displays total processed transactions
- Includes comparison with previous period
- Includes trend (increase/decrease)
- Tasks Resolved
- Displays completed tasks within a timeframe
- Indicates operational efficiency
- Pending Reviews
- Shows items awaiting action or approval
- Highlights current workload
Weekly Activity
Visual representation of activity across the week.
- Tracks:
- Queries
- Nudges
- Tasks
- Helps:
- Identify trends
- Analyze workload distribution
- Detect peak activity periods
tip
Use weekly activity for planning workload
ERP Connections
Displays status of integrated ERP systems.
- Shows:
- Connected systems (e.g., SAP, Dynamics 365)
- Connection status (Active / Last synced)
- Associated modules (FI, CO, AP, AR)
- Helps ensure data is synced and reliable
Recent Conversations
Provides access to latest system interactions.
- Displays:
- Recent queries and AI insights
- Timestamps
- Actions:
- Revisit previous conversations
- Start a New Chat
Navigation from Dashboard
Users can directly navigate to:
- Tasks - Take action on pending items
- Intelligence - Perform deeper analysis
note
Data is dependent on Integration connections and system usage